Segovia 996 m
Forecast
One line per forecast centre, each the latest run of its own model. Where they converge the outlook is settled; where they fan out, nobody knows yet. Untick any model to take it off the charts.
Run each line comes from: ECMWF 06z Mon GFS 06z Mon ICON 12z Mon UK Met Office 06z Mon Météo-France 12z Mon JMA 06z Mon GEM 00z Mon. The oldest of these started 12 hours before the newest, so a line that looks out of step may simply be working from older information.
Each line adds up that model’s rain as the days go on, so where it ends is the fortnight’s total that model expects. Lines stop where each model’s run does: ECMWF, GFS and AIFS reach two weeks; JMA and GEM stop around day 10, ICON and the UK Met Office around day 7, and Météo-France after about four days.
The daily rise and fall is the shape to read here: models that agree on the peaks are agreeing on the weather, not just on the averages.
Spikes above the line are the afternoons worth watching. JMA doesn’t publish CAPE through this source, so it has no line here.
Pressure & cloud cover
Windy’s own animated map, centred on Segovia. Open one below, then use the timeline at the bottom of the map to step through the next two weeks, or the layers menu inside it to switch what it’s showing.
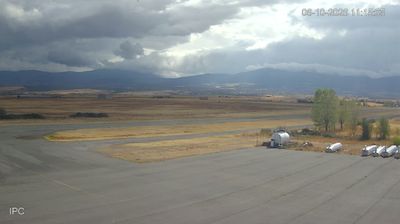
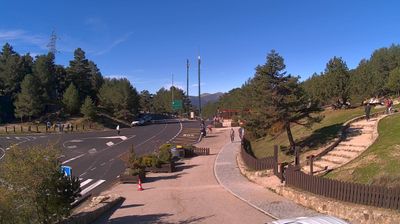
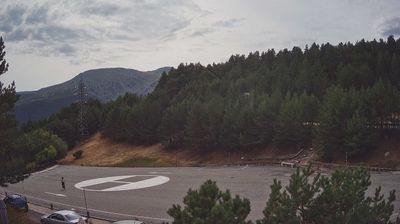
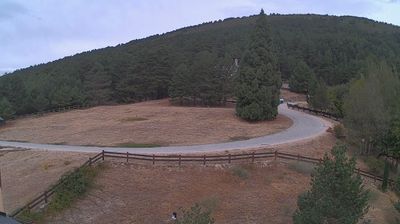
Webcams
 last daylight
 last daylight
 last daylight
 last daylight
 last daylight
It is dark at Segovia right now, so Windy cams are showing their last daylight frame. Hit Timelapse on any of them to watch the day play through.