Drei Zinnen - Tre Cime 2947 m
Where to ski, and how the pistes should feel
At resort, 2,947 m
| Day & fresh snow | Morning, 9–12 | Afternoon, 12–4 |
|---|---|---|
| Mon 16 Nov | −5°Cfeels −8° Soft SE, S facing slopes Cold & fast N, NW facing slopes Firm NE, E, SW, W facing slopes ☀ Sunny Light wind 5 km/h from NW, gusts 35 |
−4°Cfeels −7° Soft SE, S, SW facing slopes Cold & fast N, NE facing slopes Firm E, W, NW facing slopes ☀ Sunny Light wind 5 km/h from NW, gusts 35 |
| Tue 17 Nov | −2°Cfeels −7° Firm on all slopes ☁ Cloudy, little or no sun Breezy 15 km/h from SW, gusts 60 |
−2°Cfeels −7° Firm on all slopes Below the low cloud ☁ Cloudy, little or no sun Breezy 15 km/h from SW, gusts 65 |
| Wed 18 Nov | −4°Cfeels −8° Soft SE, S, SW facing slopes Firm N, NE, E, W, NW facing slopes ☀ Sunny Light wind 10 km/h from NW, gusts 45 |
−3°Cfeels −7° Soft SE, S, SW facing slopes Firm N, NE, E, W, NW facing slopes ☀ Sunny Light wind 10 km/h from NW, gusts 55 |
| Thu 19 Nov | −7°Cfeels −10° Cold & fast on all slopes Below the low cloud ☁ Cloudy, little or no sun Light wind 5 km/h from S, gusts 45 |
−6°Cfeels −10° Cold & fast on all slopes ☁ Cloudy, little or no sun Light wind 10 km/h from NW, gusts 45 |
| Fri 20 Nov | −7°Cfeels −11° Cold & fast N, NE, W, NW facing slopes Firm E, SE, S, SW facing slopes ☀ Sunny Light wind 10 km/h from NW, gusts 50 |
−5°Cfeels −10° Cold & fast N, NE, E, NW facing slopes Firm SE, S, SW, W facing slopes ☀ Sunny Light wind 15 km/h from NW, gusts 50 |
Piste map — where the snow should feel best, run by run
The Relief, Scenery and Contours buttons are new and I would like to know if they help. Tell me what you think.
Each stretch of piste is coloured for the way it faces and for the height it is at (resort, halfway or top), using the same forecast as the table above. Hover over a run, or tap it, for its name, and pinch with two fingers to zoom (or use the buttons, or hold Ctrl or ⌘ and scroll). A rule of thumb, as above: it knows nothing about grooming, closures or shadows from the mountains around. Piste and lift names are as mapped by volunteers, so some are missing or odd. Map data © OpenStreetMap contributors; slope directions from terrain heights (EU-DEM, SRTM, ASTER via OpenTopoData).
How to read this: labels, wind and lift warnings
The circle is a compass seen from above, north at the top: each eighth is the slopes facing that way, coloured by how the snow should feel there. The letters are the direction a slope faces. A rule of thumb, not a snow report: it takes the air temperature at that height and adds the warming from the sun on a 25° slope facing each way (more when the sun is high in the sky for the time of year and the model says it is out, nothing on a slope facing away from it). What the labels mean:
- Soft the sweet spot: snow just warm enough to carve, forgiving to turn.
- Cold & fast dry snow that stays hard-packed or powdery.
- Firm cool but grippy.
- Icy thawed and refroze overnight and hasn’t softened yet.
- Heavy wet and sticky.
The sun is low at this time of year, so north-facing slopes get almost none of it and keep their snow longest. It knows nothing about grooming or how much snow is down.
Wind. Speeds are the model’s wind at that height (from its 10 m wind and the winds a few thousand metres up), and “from NW” is the direction it blows from (averaged over the morning or afternoon), so ridges and tops are usually much windier than the village. “Feels like” is the standard wind-chill formula for someone standing still, so it will feel colder than that on a fast chair or a fast run. Wind also strips snow off exposed windward slopes (hard, scoured, sometimes icy) and dumps it on sheltered ones. The lift warning is a rule of thumb, not a status report: each resort sets its own limits and there is no standard number. It is mostly the gusts and the wind across the lift line that stop lifts, not the average speed. In general, from about 70 km/h gusts (or 50 km/h steady) exposed chairlifts and gondolas may slow or hold, and from about 90 km/h gusts (or 65 km/h steady) closures become likely. Modern lifts built for exposed ground often run through more. Some gondolas are reported to stop at a steady cross-wind of around 55 km/h, and surface lifts cope with more. Always check the resort’s own lift status.
Sunshine & cloud, next week
Monday 8 h · Tuesday 0 h · Wednesday 9 h · Thursday 0 h · Friday 8 h · Saturday 8 h · Sunday 0 h.
| Day | Sun | Sky | Fresh snow, cm | Cloud |
|---|---|---|---|---|
| Mon 16 Nov | 8 h | Sunny
5 km/h NW |
– | No low cloud — lifts clear |
| Tue 17 Nov | 0 h | No sun
15 km/h SW |
– | Low cloud, base about 3,300 m, tops about 4,450 m — resort below it |
| Wed 18 Nov | 9 h | Sunny
10 km/h NW |
– | No low cloud — lifts clear |
| Thu 19 Nov | 0 h | No sun
10 km/h NW |
– | Low cloud, base about 3,150 m, tops about 3,600 m — resort below it |
| Fri 20 Nov | 8 h | Sunny
15 km/h NW |
0 | No low cloud — lifts clear |
| Sat 21 Nov | 8 h | Sunny | 0 | No low cloud — lifts clear |
| Sun 22 Nov | 0 h | No sun
Snow |
3.3 | Mid/high cloud — no low layer |
How sun and cloud are worked out
Sun hours are the model’s direct sunshine reaching the ground, added up per local day (one model, Open-Meteo’s best match). Open-Meteo doesn’t publish cloud base, so it is estimated: air cools to its dew point about 125 m higher for every degree between the temperature and the dew point. That is a fair guide to low cloud and fog, and says nothing about mid or high cloud. Snow is the GFS ensemble’s average forecast for each height (the model this page opened on), so it may differ from the sun and cloud model. “In cloud” means that height is between the estimated bottom and top of a cloud layer, and “above the low cloud” that it is higher than the estimated top, so a sea of cloud below you with sun on top. Tops come from the model’s cloud cover at a few heights up the sky (roughly every 500 to 1,200 m), so they are good to a few hundred metres at best. Treat all of this as a hint, not a promise.
Forecast
Snow over the next 7 days at the resort height, by model: GFS 11 cm · ECMWF 13 cm · AIFS 14 cm. AIFS is forecasting the most — open its tab to see how far the models disagree.
Tap or click a day to see it hour by hour (Snowfall ).
The percentage under each day is the chance of snow: how many of the 31 ensemble members produce at least 1 cm . A low number under a day with no bar means almost every run shows no snow; a high one means most runs do. It measures how much the runs agree, not how certain the forecast is. Bars run light to dark from the resort up to the top lift; rain is only drawn when there is some.
31 runs of the American model (GFS), started from slightly different data, looking two weeks ahead. How much they disagree shows as the faint band on the temperature chart and the band on the freezing level chart (narrow means the forecast is worth trusting), and as the percentage under each day on the snowfall chart (high means most runs agree there is snow). Week 2 is shaded: by then the runs have usually spread so far apart that only the trend is worth reading — is it turning colder, is the freezing level coming down — not the numbers for a particular day.
Modelled on the 12z run (Thu 19 Nov, 12:00 UTC). The next run should reach this page around 01:42 Rome time. A newer run (12z, Fri 20 Nov) exists, but the refresh did not complete yet.
Each line is the average of the 31 runs at that height. The faint band behind the line is where the middle 80% of those runs sit: the wider it is, the less the runs agree. The week ahead is running about 1.5 °C above the 1991–2020 average for the date.
About the freezing level
When the band drops below the resort line, precipitation is falling as snow in the village. Model grid elevation here is 2947 m.
Tap or click a day to see it hour by hour (Snowfall ).
The percentage under each day is the chance of snow: how many of the 51 ensemble members produce at least 1 cm . A low number under a day with no bar means almost every run shows no snow; a high one means most runs do. It measures how much the runs agree, not how certain the forecast is. Bars run light to dark from the resort up to the top lift; rain is only drawn when there is some.
51 runs of the European model (ECMWF) — another independent ensemble. Read week 2 against the GFS tab: when they lean the same way the trend is worth far more than either on its own, and when they disagree, nobody really knows yet. Week 2 is shaded here for the same reason.
Modelled on the 12z run (Thu 19 Nov, 12:00 UTC). The next run is due about now, so these numbers may change shortly. A newer run (06z, Fri 20 Nov) exists, but the refresh did not complete yet.
Each line is the average of the 51 runs at that height. The faint band behind the line is where the middle 80% of those runs sit: the wider it is, the less the runs agree. The week ahead is running about 1.5 °C below the 1991–2020 average for the date.
Tap or click a day to see it hour by hour (Snowfall ).
The percentage under each day is the chance of snow: how many of the 51 ensemble members produce at least 1 cm . A low number under a day with no bar means almost every run shows no snow; a high one means most runs do. It measures how much the runs agree, not how certain the forecast is. Bars run light to dark from the resort up to the top lift; rain is only drawn when there is some.
51 runs of ECMWF's AI-based model (AIFS) — another independent ensemble. Read week 2 against the GFS tab: when they lean the same way the trend is worth far more than either on its own, and when they disagree, nobody really knows yet. Week 2 is shaded here for the same reason.
Modelled on the 12z run (Thu 19 Nov, 12:00 UTC). The next run should reach this page around 03:38 Rome time. A newer run (12z, Fri 20 Nov) exists, but the refresh did not complete yet.
Each line is the average of the 51 runs at that height. The faint band behind the line is where the middle 80% of those runs sit: the wider it is, the less the runs agree. The week ahead is running about 1 °C above the 1991–2020 average for the date.
One line per forecast centre, each the latest run of its own model. Where they converge the outlook is settled; where they fan out, nobody knows yet. Untick any model to take it off the charts.
Run each line comes from: ECMWF 00z Mon GFS 00z Mon ICON 06z Mon UK Met Office 00z Mon Météo-France 06z Mon JMA 00z Mon GEM 00z Mon. The oldest of these started 6 hours before the newest, so a line that looks out of step may simply be working from older information.
Each line adds up that model’s snowfall as the days go on, so where it ends is the total that model expects. Lines stop where each model’s run does: ECMWF, GFS and AIFS reach two weeks; JMA and GEM stop around day 10, ICON and the UK Met Office around day 7, and Météo-France after about four days. So compare lines where they overlap, not where they end.
Crust check — freeze-melt over the last week
- Cold Resort 2,947 m — stayed below freezing all week (warmest -1.2 °C): no melt-freeze crust, snow should still be loose and cold
Last snowfall
- Resort 2,947 m — 1.9 cm over 2 days (snow started Thu 12 Nov, last fell Fri 13 Nov, which is 8 days ago) · freezing level about 2,400 m, snow down to roughly 2,100 m
Measured snow depth — automatic stations, not the model
- Sillian 1,081 m, 11.9 km away — 1 cm lying now · unchanged in 24 h · +1 cm in 7 days
Snow depth at a fixed point, so it rises with new snow and falls as snow settles, melts or blows away. Compare it with the model’s figures above. Stations are on flat ground and may differ from the slopes around them. Source: GeoSphere Austria (CC BY 4.0).
How this is worked out
Worked out from the last 14 days of model analysis, moved to each height the same way as the forecast charts, so treat amounts as estimates. A thaw is a day reaching +1 °C followed by a night at or below -1 °C, or a day of rain. Air temperature only: sun on a slope can melt snow when the air is below freezing, and shade or wind can keep it from melting when it is above, so south-facing slopes crust sooner than the figures suggest.
Pressure & cloud cover
Windy’s own animated map, centred on Drei Zinnen - Tre Cime. Open one below, then use the timeline at the bottom of the map to step through the next two weeks, or the layers menu inside it to switch what it’s showing.
Webcams
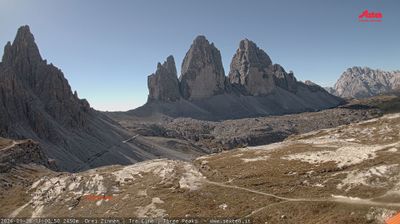 last daylight
 last daylight
 last daylight
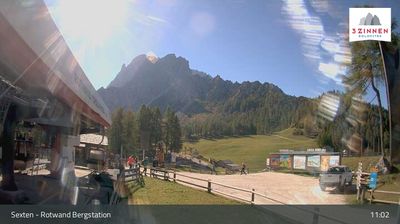 last daylight
 last daylight
 last daylight
It is dark at Drei Zinnen - Tre Cime right now, so Windy cams are showing their last daylight frame. Hit Timelapse on any of them to watch the day play through.